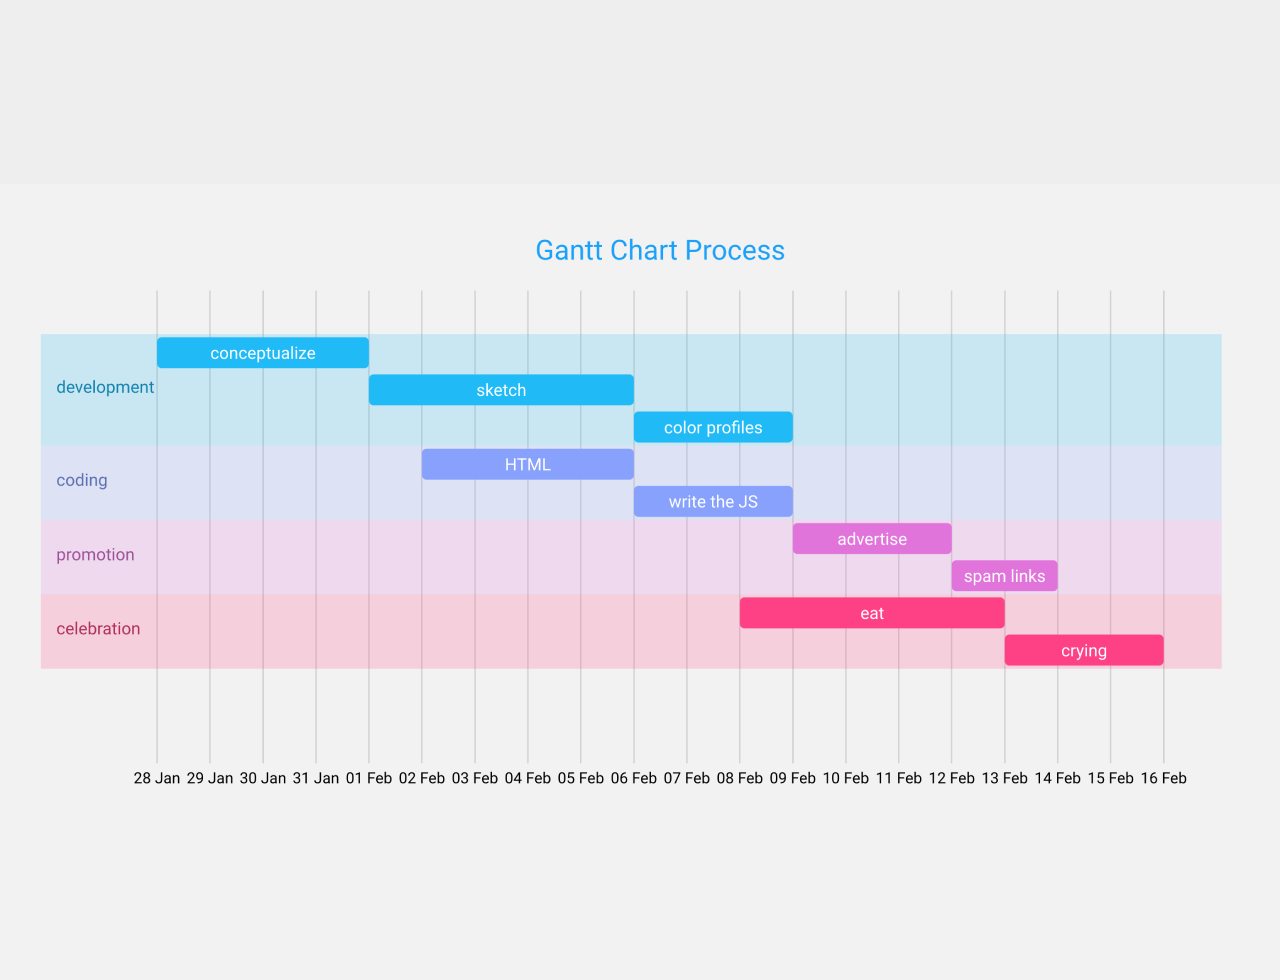

This code generates an Interactive Gantt Chart using D3 JS. It visualizes tasks over time. The chart displays task types, start, and end times. It helps manage project timelines visually. The chart color-codes tasks by type for easy distinction.
You can use this code for project management. It helps track tasks visually, aiding in schedule planning.
How to Create Interactive Gantt Chart Using D3 Js
1. First of all, load the D3 JS by adding the following CDN link into the head tag of your HTML document.
<script src='https://cdnjs.cloudflare.com/ajax/libs/d3/3.3.3/d3.min.js'></script>
2. Create the necessary HTML structure. Use the following code snippet that includes the div elements for the container and SVG:
<div id = "container">
<div class = "svg"></div>
<div id = "tag"></div>
</div>
3. Now, use the following CSS code to style the Gantt Chart and its elements. This code ensures proper layout and appearance.
* {
      margin: 0;
      padding: 0;
  }

  body {
      background: #fff;
      font-family: 'Open-Sans',sans-serif;

  }

#container{
  margin: 0 auto;
  position: relative;
  width:800px;
  overflow: visible;
}


  .svg {
    width:800px;
    height:400px;
    overflow: visible;
    position:absolute;
}

.grid .tick {
    stroke: lightgrey;
    opacity: 0.3;
    shape-rendering: crispEdges;
}
.grid path {
      stroke-width: 0;
}


#tag {
  color: white;
  background: #FA283D;
  width: 150px;
  position: absolute;
  display: none;
  padding:3px 6px;
  margin-left: -80px;
  font-size: 11px;
}


#tag:before {
  border: solid transparent;
  content: ' ';
  height: 0;
  left: 50%;
  margin-left: -5px;
  position: absolute;
  width: 0;
  border-width: 10px;
  border-bottom-color: #FA283D;
  top: -20px;
}
4. Finally, add the following JavaScript function to activate the chart. Define your tasks in the JavaScript code. Modify the taskArray variable to include your project’s tasks. Specify task names, types, start times, end times, and additional details if needed.
Adjust parameters like chart dimensions, colors, and padding within the makeGant function to suit your project requirements.
var w = 800;
  var h = 400;


  var svg = d3.selectAll(".svg")
  //.selectAll("svg")
  .append("svg")
  .attr("width", w)
  .attr("height", h)
  .attr("class", "svg");


    var taskArray = [
  {
    task: "conceptualize",
    type: "development",
    startTime: "2013-1-28", //year/month/day
    endTime: "2013-2-1",
    details: "This actually didn't take any conceptualization"
},

{
    task: "sketch",
    type: "development",
    startTime: "2013-2-1",
    endTime: "2013-2-6",
    details: "No sketching either, really"
},

{
    task: "color profiles",
    type: "development",
    startTime: "2013-2-6",
    endTime: "2013-2-9"
},

{
    task: "HTML",
    type: "coding",
    startTime: "2013-2-2",
    endTime: "2013-2-6",
    details: "all three lines of it"
},

{
    task: "write the JS",
    type: "coding",
    startTime: "2013-2-6",
    endTime: "2013-2-9"
},

{
    task: "advertise",
    type: "promotion",
    startTime: "2013-2-9",
    endTime: "2013-2-12",
    details: "This counts, right?"
},

{
    task: "spam links",
    type: "promotion",
    startTime: "2013-2-12",
    endTime: "2013-2-14"
},
{
    task: "eat",
    type: "celebration",
    startTime: "2013-2-8",
    endTime: "2013-2-13",
    details: "All the things"
},

{
    task: "crying",
    type: "celebration",
    startTime: "2013-2-13",
    endTime: "2013-2-16"
},

];

var dateFormat = d3.time.format("%Y-%m-%d");

var timeScale = d3.time.scale()
        .domain([d3.min(taskArray, function(d) {return dateFormat.parse(d.startTime);}),
                 d3.max(taskArray, function(d) {return dateFormat.parse(d.endTime);})])
        .range([0,w-150]);

var categories = new Array();

for (var i = 0; i < taskArray.length; i++){
    categories.push(taskArray[i].type);
}

var catsUnfiltered = categories; //for vert labels

categories = checkUnique(categories);


makeGant(taskArray, w, h);

var title = svg.append("text")
              .text("Gantt Chart Process")
              .attr("x", w/2)
              .attr("y", 25)
              .attr("text-anchor", "middle")
              .attr("font-size", 18)
              .attr("fill", "#009FFC");


function makeGant(tasks, pageWidth, pageHeight){

var barHeight = 20;
var gap = barHeight + 4;
var topPadding = 75;
var sidePadding = 75;

var colorScale = d3.scale.linear()
    .domain([0, categories.length])
    .range(["#00B9FA", "#F95002"])
    .interpolate(d3.interpolateHcl);

makeGrid(sidePadding, topPadding, pageWidth, pageHeight);
drawRects(tasks, gap, topPadding, sidePadding, barHeight, colorScale, pageWidth, pageHeight);
vertLabels(gap, topPadding, sidePadding, barHeight, colorScale);

}


function drawRects(theArray, theGap, theTopPad, theSidePad, theBarHeight, theColorScale, w, h){

var bigRects = svg.append("g")
    .selectAll("rect")
   .data(theArray)
   .enter()
   .append("rect")
   .attr("x", 0)
   .attr("y", function(d, i){
      return i*theGap + theTopPad - 2;
  })
   .attr("width", function(d){
      return w-theSidePad/2;
   })
   .attr("height", theGap)
   .attr("stroke", "none")
   .attr("fill", function(d){
    for (var i = 0; i < categories.length; i++){
        if (d.type == categories[i]){
          return d3.rgb(theColorScale(i));
        }
    }
   })
   .attr("opacity", 0.2);


     var rectangles = svg.append('g')
     .selectAll("rect")
     .data(theArray)
     .enter();


   var innerRects = rectangles.append("rect")
             .attr("rx", 3)
             .attr("ry", 3)
             .attr("x", function(d){
              return timeScale(dateFormat.parse(d.startTime)) + theSidePad;
              })
             .attr("y", function(d, i){
                return i*theGap + theTopPad;
            })
             .attr("width", function(d){
                return (timeScale(dateFormat.parse(d.endTime))-timeScale(dateFormat.parse(d.startTime)));
             })
             .attr("height", theBarHeight)
             .attr("stroke", "none")
             .attr("fill", function(d){
              for (var i = 0; i < categories.length; i++){
                  if (d.type == categories[i]){
                    return d3.rgb(theColorScale(i));
                  }
              }
             })


         var rectText = rectangles.append("text")
               .text(function(d){
                return d.task;
               })
               .attr("x", function(d){
                return (timeScale(dateFormat.parse(d.endTime))-timeScale(dateFormat.parse(d.startTime)))/2 + timeScale(dateFormat.parse(d.startTime)) + theSidePad;
                })
               .attr("y", function(d, i){
                  return i*theGap + 14+ theTopPad;
              })
               .attr("font-size", 11)
               .attr("text-anchor", "middle")
               .attr("text-height", theBarHeight)
               .attr("fill", "#fff");


rectText.on('mouseover', function(e) {
 // console.log(this.x.animVal.getItem(this));
               var tag = "";

         if (d3.select(this).data()[0].details != undefined){
          tag = "Task: " + d3.select(this).data()[0].task + "<br/>" +
                "Type: " + d3.select(this).data()[0].type + "<br/>" +
                "Starts: " + d3.select(this).data()[0].startTime + "<br/>" +
                "Ends: " + d3.select(this).data()[0].endTime + "<br/>" +
                "Details: " + d3.select(this).data()[0].details;
         } else {
          tag = "Task: " + d3.select(this).data()[0].task + "<br/>" +
                "Type: " + d3.select(this).data()[0].type + "<br/>" +
                "Starts: " + d3.select(this).data()[0].startTime + "<br/>" +
                "Ends: " + d3.select(this).data()[0].endTime;
         }
         var output = document.getElementById("tag");

          var x = this.x.animVal.getItem(this) + "px";
          var y = this.y.animVal.getItem(this) + 25 + "px";

         output.innerHTML = tag;
         output.style.top = y;
         output.style.left = x;
         output.style.display = "block";
       }).on('mouseout', function() {
         var output = document.getElementById("tag");
         output.style.display = "none";
             });


innerRects.on('mouseover', function(e) {
 //console.log(this);
         var tag = "";

         if (d3.select(this).data()[0].details != undefined){
          tag = "Task: " + d3.select(this).data()[0].task + "<br/>" +
                "Type: " + d3.select(this).data()[0].type + "<br/>" +
                "Starts: " + d3.select(this).data()[0].startTime + "<br/>" +
                "Ends: " + d3.select(this).data()[0].endTime + "<br/>" +
                "Details: " + d3.select(this).data()[0].details;
         } else {
          tag = "Task: " + d3.select(this).data()[0].task + "<br/>" +
                "Type: " + d3.select(this).data()[0].type + "<br/>" +
                "Starts: " + d3.select(this).data()[0].startTime + "<br/>" +
                "Ends: " + d3.select(this).data()[0].endTime;
         }
         var output = document.getElementById("tag");

         var x = (this.x.animVal.value + this.width.animVal.value/2) + "px";
         var y = this.y.animVal.value + 25 + "px";

         output.innerHTML = tag;
         output.style.top = y;
         output.style.left = x;
         output.style.display = "block";
       }).on('mouseout', function() {
         var output = document.getElementById("tag");
         output.style.display = "none";

 });


}


function makeGrid(theSidePad, theTopPad, w, h){

var xAxis = d3.svg.axis()
    .scale(timeScale)
    .orient('bottom')
    .ticks(d3.time.days, 1)
    .tickSize(-h+theTopPad+20, 0, 0)
    .tickFormat(d3.time.format('%d %b'));

var grid = svg.append('g')
    .attr('class', 'grid')
    .attr('transform', 'translate(' +theSidePad + ', ' + (h - 50) + ')')
    .call(xAxis)
    .selectAll("text")
            .style("text-anchor", "middle")
            .attr("fill", "#000")
            .attr("stroke", "none")
            .attr("font-size", 10)
            .attr("dy", "1em");
}

function vertLabels(theGap, theTopPad, theSidePad, theBarHeight, theColorScale){
  var numOccurances = new Array();
  var prevGap = 0;

  for (var i = 0; i < categories.length; i++){
    numOccurances[i] = [categories[i], getCount(categories[i], catsUnfiltered)];
  }

  var axisText = svg.append("g") //without doing this, impossible to put grid lines behind text
   .selectAll("text")
   .data(numOccurances)
   .enter()
   .append("text")
   .text(function(d){
    return d[0];
   })
   .attr("x", 10)
   .attr("y", function(d, i){
    if (i > 0){
        for (var j = 0; j < i; j++){
          prevGap += numOccurances[i-1][1];
         // console.log(prevGap);
          return d[1]*theGap/2 + prevGap*theGap + theTopPad;
        }
    } else{
    return d[1]*theGap/2 + theTopPad;
    }
   })
   .attr("font-size", 11)
   .attr("text-anchor", "start")
   .attr("text-height", 14)
   .attr("fill", function(d){
    for (var i = 0; i < categories.length; i++){
        if (d[0] == categories[i]){
        //  console.log("true!");
          return d3.rgb(theColorScale(i)).darker();
        }
    }
   });

}

//from this stackexchange question: http://stackoverflow.com/questions/1890203/unique-for-arrays-in-javascript
function checkUnique(arr) {
    var hash = {}, result = [];
    for ( var i = 0, l = arr.length; i < l; ++i ) {
        if ( !hash.hasOwnProperty(arr[i]) ) { //it works with objects! in FF, at least
            hash[ arr[i] ] = true;
            result.push(arr[i]);
        }
    }
    return result;
}

//from this stackexchange question: http://stackoverflow.com/questions/14227981/count-how-many-strings-in-an-array-have-duplicates-in-the-same-array
function getCounts(arr) {
    var i = arr.length, // var to loop over
        obj = {}; // obj to store results
    while (i) obj[arr[--i]] = (obj[arr[i]] || 0) + 1; // count occurrences
    return obj;
}

// get specific from everything
function getCount(word, arr) {
    return getCounts(arr)[word] || 0;
}
Feel free to modify the code further to suit your specific project needs or integrate it into your web application for streamlined project management.
That’s all! hopefully, you have successfully created a Gantt Chart Using D3 JS. If you have any questions or suggestions, feel free to comment below.
Similar Code Snippets:
 HTML Horizontal Bar Chart
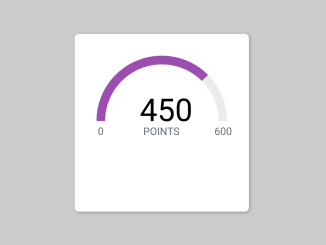
- Dynamic Semi Circle Progress Bar CSS
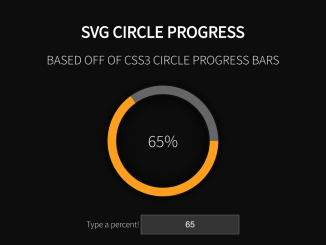
- SVG Circle Progress With Percentage Value
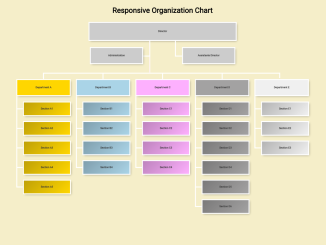
- Responsive Organization Chart Using Pure CSS
- Gauge Chart With Needle in JavaScript


I code and create web elements for amazing people around the world. I like work with new people. New people new Experiences.
I truly enjoy what I’m doing, which makes me more passionate about web development and coding. I am always ready to do challenging tasks whether it is about creating a custom CMS from scratch or customizing an existing system.