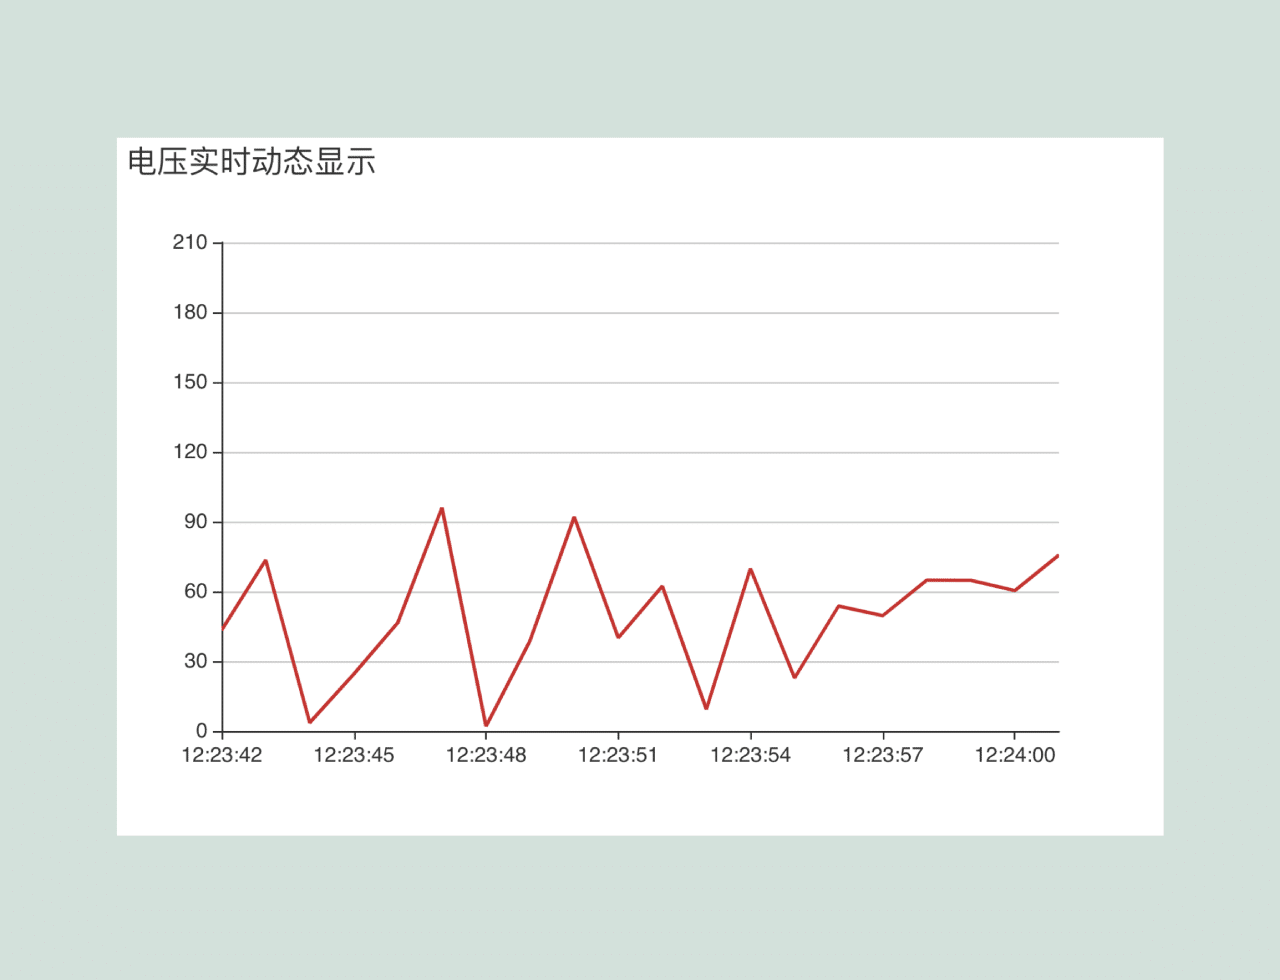

This code snippet helps you to create a dynamic chart showing realtime updating data. It uses the Apache ECharts library. The chart displays voltage changes over time. The JavaScript code fetches and updates the chart with simulated real-time voltage values. It helps visualize and track live voltage fluctuations.
You can use this code to create real-time voltage charts for monitoring systems. It’s beneficial for tracking live voltage changes in IoT devices.
How to Create Realtime Updating Chart Using Apache Echarts
1. First of all, add the ECharts library by including the CDN link in the <head> section of your HTML file:
<script src="https://cdn.staticfile.org/echarts/4.2.1/echarts.min.js"></script>
2. Define a container in your HTML file where the chart will be displayed. For instance:
<div id="voltageChart" style="width: 600px;height:400px;"></div>
3. You can style the chart container or other elements as desired. (The following code doesn’t include specific CSS styles for the chart.)
* {
  margin: 0;
  padding: 0;
}
#chart-container {
  position: relative;
  height: 100vh;
  overflow: hidden;
}
4. Finally, use JavaScript to initialize the ECharts instance, configure the chart, and simulate real-time data updates. Initialize the ECharts instance and set the chart’s initial configuration. Simulate real-time data updates by defining an interval function.
Inside the interval function, generate random voltage data and update the chart’s x-axis with time data and y-axis with voltage values.
        // 初始化 ECharts 实例
        var voltageChart = echarts.init(document.getElementById('voltageChart'));

        // 设置图表配置项和数据
        var option = {
            title: {
                text: '电压实时动态显示'
            },
            tooltip: {
                trigger: 'axis',
                axisPointer: {
                    animation: false
                }
            },
            xAxis: {
                type: 'category',
                boundaryGap: false,
                data: []
            },
            yAxis: {
                type: 'value',
                boundaryGap: [0, '100%']
            },
            series: [{
                name: '电压值',
                type: 'line',
                showSymbol: false,
                hoverAnimation: false,
                data: []
            }]
        };

        // 使用刚指定的配置项和数据显示图表
        voltageChart.setOption(option);

        // 模拟实时数据更新
        var timeData = [];
        var voltageData = [];

        setInterval(function () {
            var now = new Date();
            var value = Math.random() * 100;  // 模拟电压值
            timeData.push(now.toLocaleTimeString());
            voltageData.push(value.toFixed(2));

            if (timeData.length > 20) {
                timeData.shift();
                voltageData.shift();
            }

            voltageChart.setOption({
                xAxis: {
                    data: timeData
                },
                series: [{
                    data: voltageData
                }]
            });
        }, 1000);
That’s all! hopefully, you have successfully created a Realtime Updating Chart Using Apache ECharts library. If you have any questions or suggestions, feel free to comment below.
Similar Code Snippets:
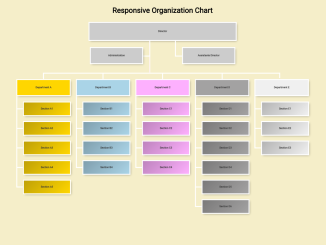
 Responsive Organization Chart Using Pure CSS
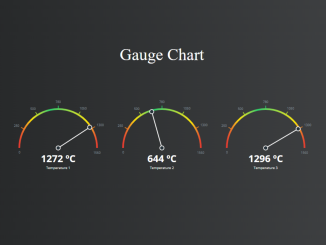
- Gauge Chart With Needle in JavaScript
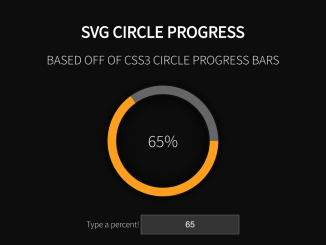
- SVG Circle Progress With Percentage Value
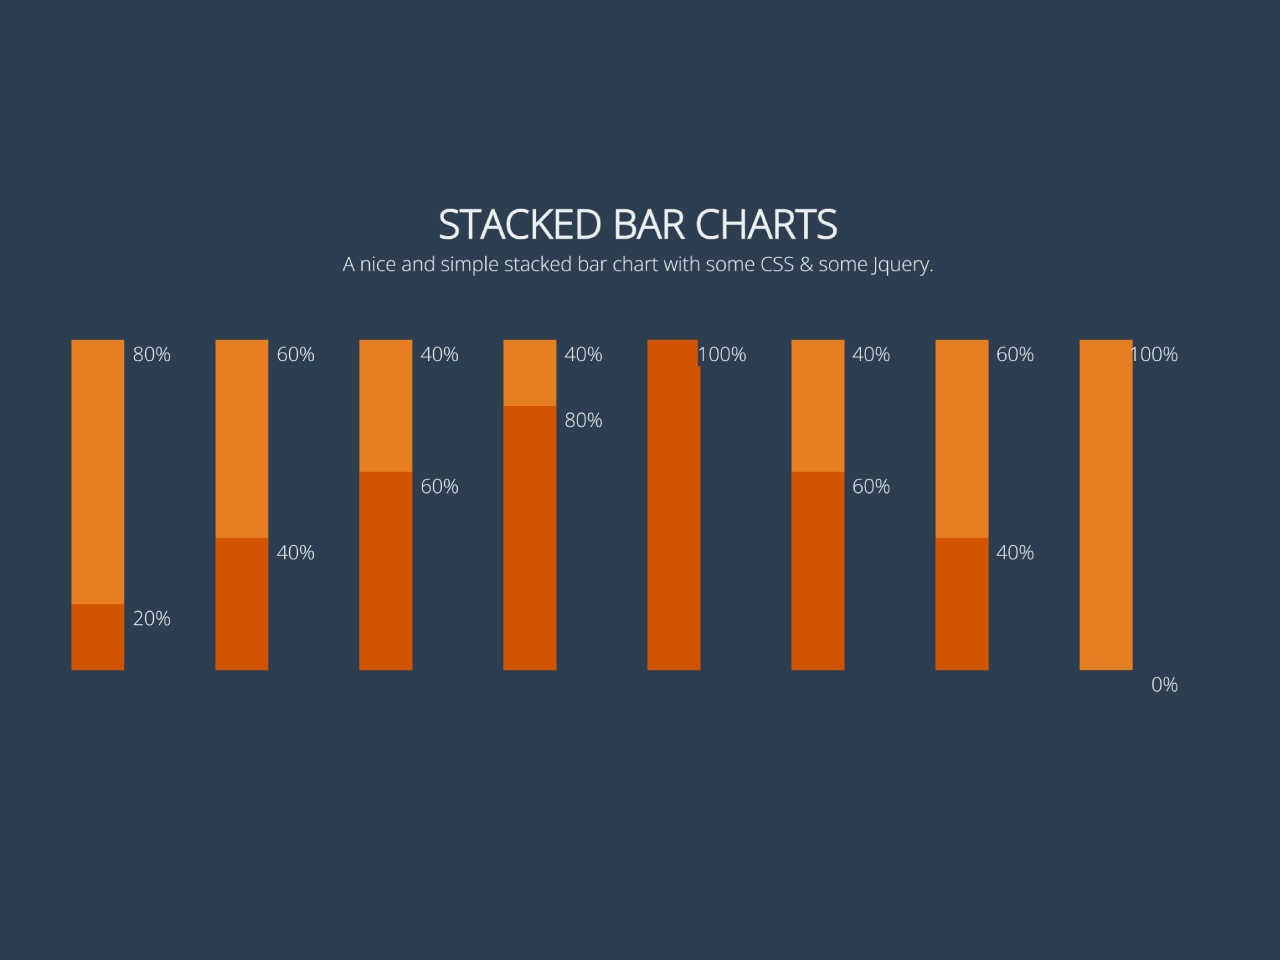
- CSS Vertical Stacked Bar Chart
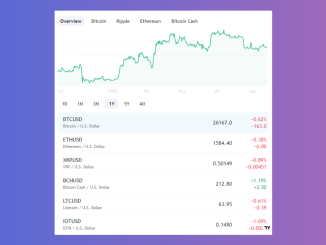
- Cryptocurrency Price Widget for Website
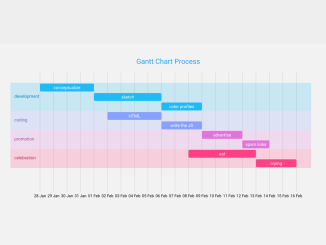
- Interactive Gantt Chart Using D3 JS

I code and create web elements for amazing people around the world. I like work with new people. New people new Experiences.
I truly enjoy what I’m doing, which makes me more passionate about web development and coding. I am always ready to do challenging tasks whether it is about creating a custom CMS from scratch or customizing an existing system.