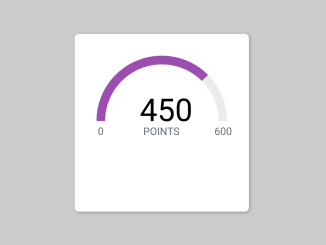
This code creates a dynamic semi-circle progress bar using HTML, CSS, and JavaScript. It visually represents progress as a filled semi-circle and displays points earned within a specified range. This is helpful for tracking and displaying progress or achievements on websites or applications.
You can use this code on your website or app to showcase progress or achievements, engaging users visually. It offers a dynamic and eye-catching way to display point-based milestones, enhancing user experience. Additionally, its customizable CSS allows seamless integration with your website’s design.
How to Create Dynamic Semi-Circle Progress Bar Css
1. Begin by adding the necessary HTML structure to your webpage. You can place this code wherever you want the progress bar to appear.
<div class="widget">
  <div class="progress-container">
    <div class="progress-bar" id="loyalty">
      <div class="points">points</div>
    </div>
  </div>
</div>
2. Next, apply the CSS styles to make the progress bar visually appealing and fit your website’s design. Customize colors, sizes, and fonts to match your preferences.
.progress-container {
  position: relative;
}

.progress-bar {
}

.progress-bar:before {
  content: "0";
  position: absolute;
  left: 2px;
  bottom: 60px;
  font-size: 12px;
  color: rgba(98, 107, 114, 1);
}

.progress-bar:after {
  content: "600";
  position: absolute;
  right: -6px;
  bottom: 60px;
  font-size: 12px;
  color: rgba(98, 107, 114, 1);
}

.widget {
  padding: 25px;
  margin: 0 auto;
  width: 150px;
  margin-top: 25px;
  background-color: #fff;
  -background-color: #222d3a;
  border-radius: 5px;
  box-shadow: 1px 1px 4px 0px rgba(0, 0, 0, 0.3);
  position: relative;
}

.points {
  position: absolute;
  margin: 0 auto;
  left: 0;
  right: 0;
  bottom: 60px;
  text-align: center;
  text-transform: uppercase;
  color: rgba(98, 107, 114, 1);
  font-size: 12px;
}
3. Load the D3 JS (charting library) by adding the following CDN link before closing the body tag:
<script src='//cdnjs.cloudflare.com/ajax/libs/d3/3.5.5/d3.min.js'></script>
4. Finally, include the JavaScript code to make the progress bar dynamic. This code calculates and animates the progress based on your specified values.
var points = 450;
var maxPoints = 600;
var percent = points / maxPoints * 100;
var ratio = percent / 100;
var pie = d3.layout
  .pie()
  .value(function(d) {
    return d;
  })
  .sort(null);
var w = 150,
  h = 150;
var outerRadius = w / 2 - 10;
var innerRadius = 75;
var color = ["#ececec", "rgba(156,78,176,1)", "#888888"];
var colorOld = "#F00";
var colorNew = "#0F0";
var arc = d3.svg
  .arc()
  .innerRadius(innerRadius)
  .outerRadius(outerRadius)
  .startAngle(0)
  .endAngle(Math.PI);

var arcLine = d3.svg
  .arc()
  .innerRadius(innerRadius)
  .outerRadius(outerRadius)
  .startAngle(0);

var svg = d3
  .select("#loyalty")
  .append("svg")
  .attr({
    width: w,
    height: h,
    class: "shadow"
  })
  .append("g")
  .attr({
    transform: "translate(" + w / 2 + "," + h / 2 + ")"
  });

var path = svg
  .append("path")
  .attr({
    d: arc,
    transform: "rotate(-90)"
  })
  .style({
    fill: color[0]
  });

var pathForeground = svg
  .append("path")
  .datum({ endAngle: 0 })
  .attr({
    d: arcLine,
    transform: "rotate(-90)"
  })
  .style({
    fill: function(d, i) {
      return color[1];
    }
  });

var middleCount = svg
  .append("text")
  .datum(0)
  .text(function(d) {
    return d;
  })
  .attr({
    class: "middleText",
    "text-anchor": "middle",
    dy: 0,
    dx: 5
  })
  .style({
    fill: d3.rgb("#000000"),
    "font-size": "36px"
  });

var oldValue = 0;
var arcTween = function(transition, newValue, oldValue) {

  transition.attrTween("d", function(d) {
    var interpolate = d3.interpolate(d.endAngle, Math.PI * (newValue / 100));
    var interpolateCount = d3.interpolate(oldValue, newValue);

    return function(t) {
      d.endAngle = interpolate(t);
      // change percentage to points before rendering text
      middleCount.text(Math.floor(interpolateCount(t)/100*maxPoints));

      return arcLine(d);
    };
  });
};

pathForeground
  .transition()
  .duration(750)
  .ease("cubic")
  .call(arcTween, percent, oldValue, points);
You can adjust the points and maxPoints variables to set your desired point values. Customize the CSS to change the appearance of the progress bar to match your website’s style.
That’s all! hopefully, you have successfully created a Semi Circle Progress Bar. If you have any questions or suggestions, feel free to comment below.
Similar Code Snippets:

I code and create web elements for amazing people around the world. I like work with new people. New people new Experiences.
I truly enjoy what I’m doing, which makes me more passionate about web development and coding. I am always ready to do challenging tasks whether it is about creating a custom CMS from scratch or customizing an existing system.

