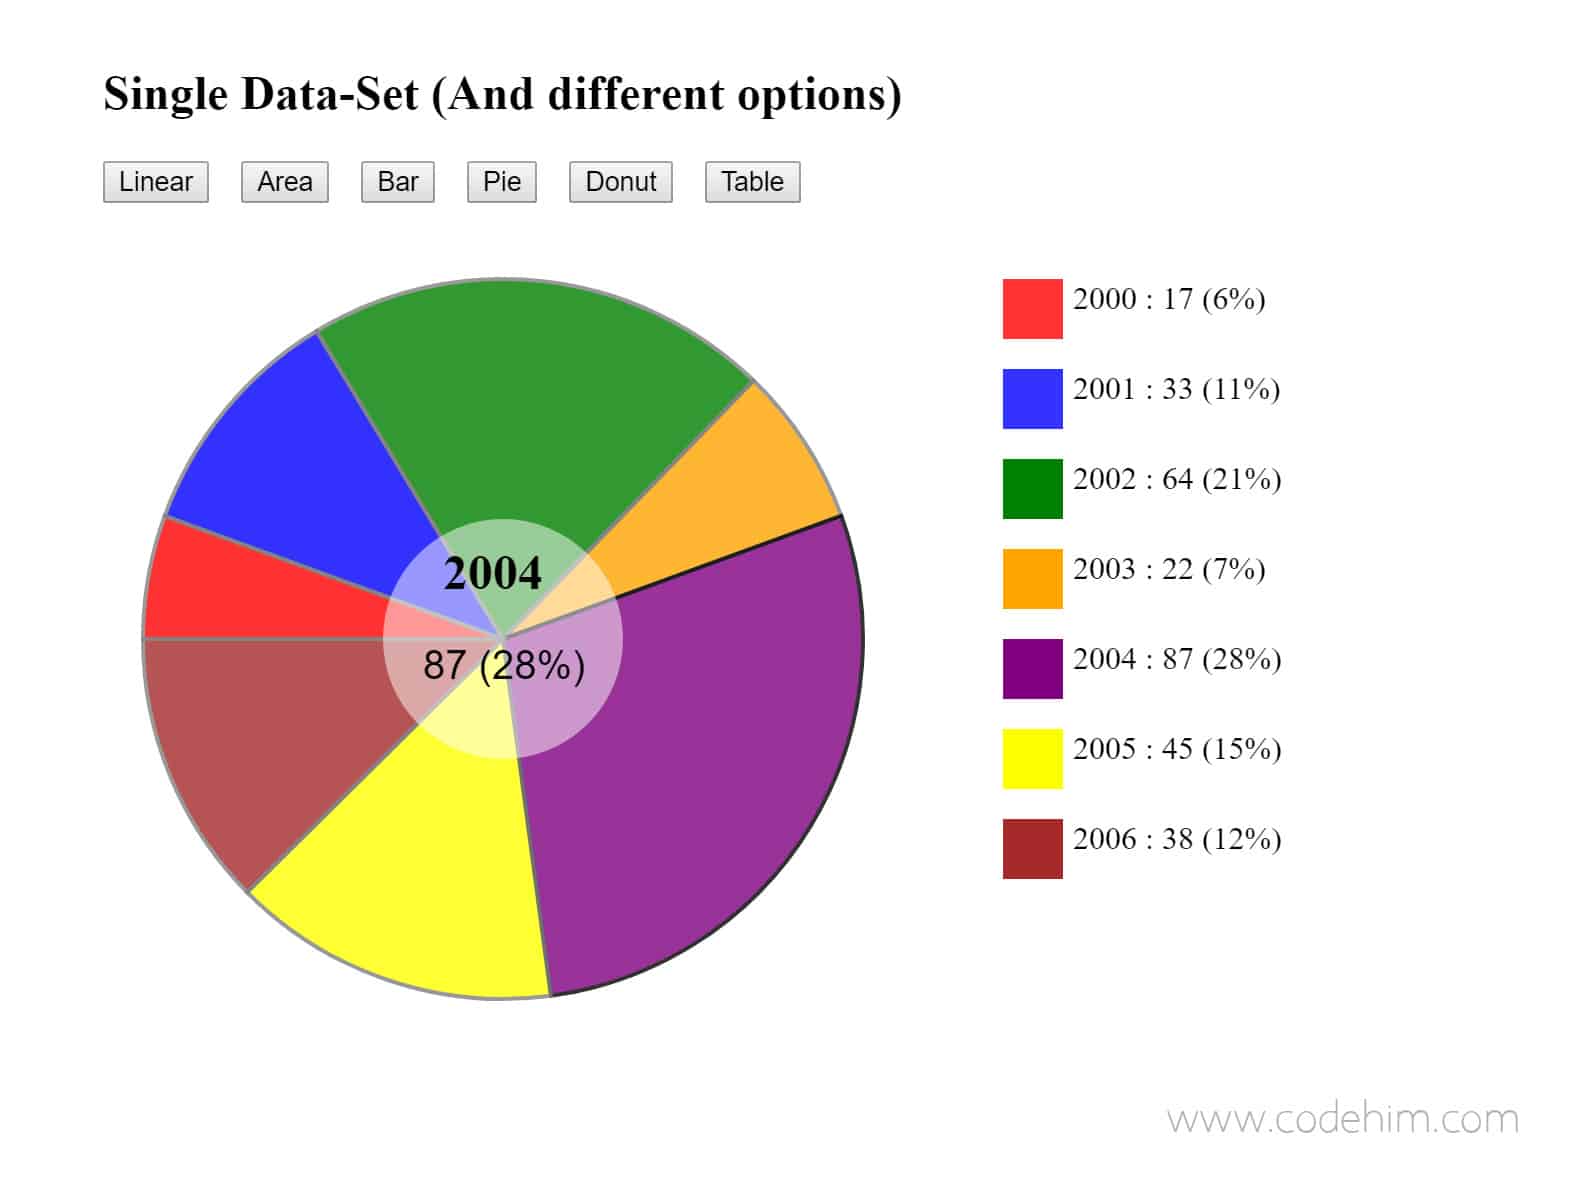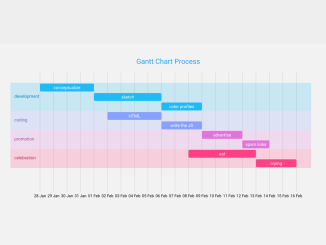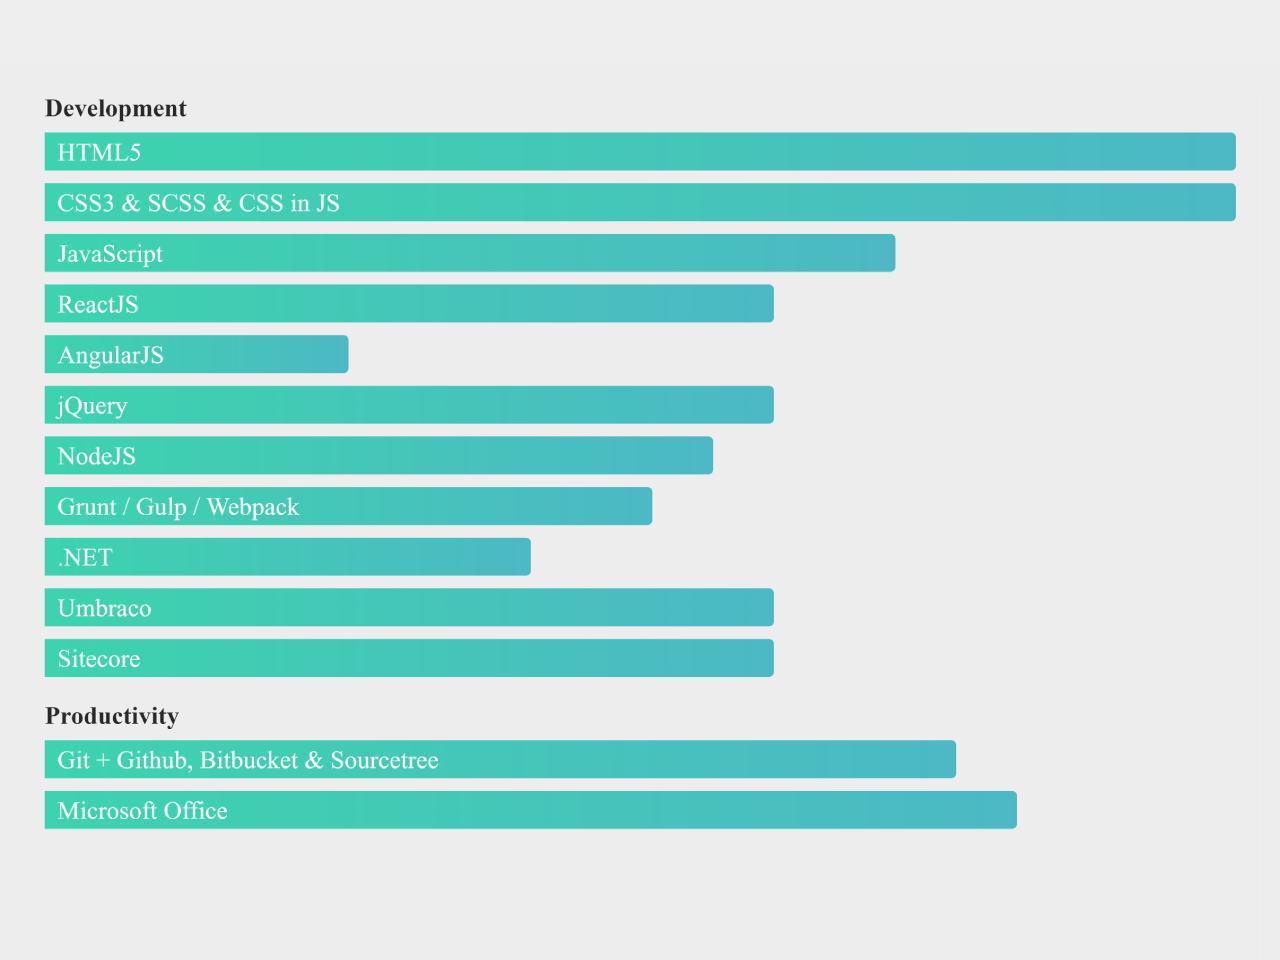
The “Graph.js” is a lightweight, highly customizable and powerful chart plugin for JavaScript / jQuery. It makes easy to create Pie, Bar, Linear or table chart in HTML pages using JavaScript objects values. The plugin build SVG based high definition graphs and charts. You just need to define your chart values in plugin configurations.
Furthermore, you can fully customize chart’s elements (size, style, data etc) according to your needs.
Plugin Overview
| Plugin: | Graph.js |
| Author: | Uriah Sanders |
| Licence: | MIT Licence |
| Published: | January 19, 2024 |
| Repository: | Fork on GitHub |
| Dependencies: | jQuery 1.3.1 or Latest version |
| File Type: | zip archive (HTML, CSS & JavaScript ) |
| Package Size: | 24.8 KB |
How to Create Pie Chart using JavaScript
1. To create pie chart in HTML we need to getting stared with graph.js, so load jQuery and graph.js JavaScript file into your HTML document.
<!-- jQuery -->
<script src="https://code.jquery.com/jquery-3.4.1.min.js"></script>

<!-- Graph JS -->
<script src="js/graph.js"></script>
2. In the next step, create a container (a div element) with a unique id in which your chart will be generated dynamically.
<div id="graph"></div>
3. Now define your chart data in plugin configuration and initialize it in jQuery document ready function.
$(document).ready(function(){

			$('#graph').graphify({
				//options: true,
				start: 'combo',
				obj: {
					id: 'ggg',
					width: 775,
					height: 375,
					xGrid: false,
					legend: true,
					title: 'Linux vs Mac',
					points: [
						[7, 26, 33, 74, 12, 49, 33],
						[32, 46, 75, 38, 62, 20, 52]
					],
					pointRadius: 3,
					colors: ['blue', 'red'],
					xDist: 90,
					dataNames: ['Linux', 'Mac'],
					xName: 'Day',
					tooltipWidth: 15,
					animations: true,
					pointAnimation: true,
					averagePointRadius: 10,
					design: {
						tooltipColor: '#fff',
						gridColor: 'grey',
						tooltipBoxColor: 'green',
						averageLineColor: 'green',
						pointColor: 'green',
						lineStrokeColor: 'grey',
					}
				}
			});

});
Similarly, you can create bar, pie or linear charts. Browse the demo page for all built-in examples.
Similar Code Snippets:

I code and create web elements for amazing people around the world. I like work with new people. New people new Experiences.
I truly enjoy what I’m doing, which makes me more passionate about web development and coding. I am always ready to do challenging tasks whether it is about creating a custom CMS from scratch or customizing an existing system.

