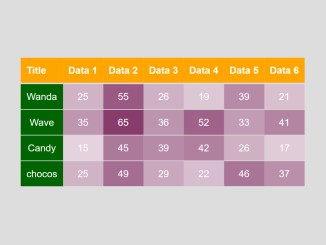
This code snippet helps you to set HTML table row color based on value inside the cell. It uses JavaScript to calculate a color for each row based on its value relative to the maximum value in the table. The colors are interpolated between a user-defined start color and a user-defined end color.
You can use this code to create heatmaps or other data visualizations where the color of each row indicates the magnitude of its value. For example, this code is helpful for coloring a table of sales data by region, with the darkest rows indicating the regions with the highest sales.
How to Create HTML Table Row Color Based On Value
1. First of all, load the Bootstrap and jQuery by adding the following CDN links into the head tag of your HTML file:
<link rel='stylesheet' href='https://cdnjs.cloudflare.com/ajax/libs/twitter-bootstrap/3.3.7/css/bootstrap.min.css'>
<script src='https://cdnjs.cloudflare.com/ajax/libs/jquery/3.2.1/jquery.min.js'></script>
<script src='https://cdnjs.cloudflare.com/ajax/libs/twitter-bootstrap/3.3.7/js/bootstrap.min.js'></script>
2. Now, create the HTML structure for your table. Include the class “heat-map” in your table’s <tbody> tag. This class is crucial for the code to target the correct elements and apply the heat map effect.
<div class="container">

<table  cellpadding="0" cellspacing="0" border="0" class="heat-map table">
    <thead>
        <tr>
            <th class="first">Title</th>
            <th>data 1</th>
            <th>data 2</th>
            <th>data 3</th>
            <th>data 4</th>
            <th>data 5</th>
            <th class="last">data 6</th>
        </tr>
    </thead>
    <tbody>
        <tr class="stats-row">
            <td class="stats-title">Wanda</td>
            <td>25</td>
            <td>55</td>
            <td>26</td>
            <td>19</td>
            <td>39</td>
            <td>21</td>
        </tr>
		<tr class="stats-row">
            <td class="stats-title">Wave</td>
            <td>35</td>
            <td>65</td>
            <td>36</td>
            <td>52</td>
            <td>33</td>
            <td>41</td>
        </tr>

		<tr class="stats-row">
            <td class="stats-title">Candy</td>
            <td>15</td>
            <td>45</td>
            <td>39</td>
            <td>42</td>
            <td>26</td>
            <td>17</td>
        </tr>

      	<tr class="stats-row">
            <td class="stats-title">chocos</td>
            <td>25</td>
            <td>49</td>
            <td>29</td>
            <td>22</td>
            <td>46</td>
            <td>37</td>
        </tr>


    </tbody>
</table>
</div>
3. Style the table using the following CSS styles:
.table{

  margin:20px auto;

}

tr>td:first-child{
  background:darkgreen;
  color:#fff;
  box-shadow:1px 0px 1px #379007;
 }
 th{
   background:orange;
   color:#fff;
   padding:10px 15px;

   text-align:center;
   text-transform:capitalize;
 }
 td{
    padding:10px 15px;
	text-align:center;
	color:#fff;
 }
4. Finally, insert the JavaScript code inside a <script> tag or in an external file. Make sure to include it within the $(document).ready(function(){}) block to ensure it runs when the document is fully loaded.
Modify the RGB color values in the JavaScript code to achieve the desired color scheme for your table rows. Adjust the xr, xg, xb, yr, yg, and yb variables to match your preferred color range.
$(document).ready(function(){
        Array.max = function(array){
        return Math.max.apply(Math,array);
    };

    var counts= $('.heat-map tbody td').not('.stats-title').map(function() {
        return parseInt($(this).text());
    }).get();

    var max = Array.max(counts);
    console.log(counts);
	console.log(max);
    n = 90;

    xr = 255; // Red value
    xg = 255; // Green value
    xb = 255; // Blue value

  //User Defined Color
    yr = 143; // Red value
    yg =72; // Green value
    yb = 117; // Blue value


    $('.heat-map tbody td').not('.stats-title').each(function(){
        var val = parseInt($(this).text());
		console.log(val);
        var pos = parseInt((Math.round((val/max)*80)).toFixed(0));
		console.log(pos);
        red = parseInt((xr + (( pos * (yr - xr)) / (n-15))).toFixed(0));
		console.log(red);
        green = parseInt((xg + (( pos * (yg - xg)) / (n-15))).toFixed(0));
		console.log(green);
        blue = parseInt((xb + (( pos * (yb - xb)) / (n-15))).toFixed(0));
		console.log(blue);
        clr = 'rgb('+red+','+green+','+blue+')';
		console.log(clr);
		$(this).css({backgroundColor:clr});
    });
});
That’s all! hopefully, you have successfully created a feature to set HTML Table row color based on value. If you have any questions or suggestions, feel free to comment below.
Similar Code Snippets:

I code and create web elements for amazing people around the world. I like work with new people. New people new Experiences.
I truly enjoy what I’m doing, which makes me more passionate about web development and coding. I am always ready to do challenging tasks whether it is about creating a custom CMS from scratch or customizing an existing system.


