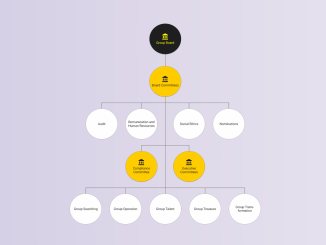
This code helps you to create a responsive organization chart using HTML and CSS. It allows you to visualize the hierarchy of different groups and committees within an organization. The code uses flexible layouts and CSS styles to represent the chart elements, making it responsive to different screen sizes. This chart can be helpful for displaying the structure of your organization in a clear and organized way.
How to Create Responsive Organization Chart HTML CSS
1. First of all, load the Material Icons and Normalize CSS by adding the following CDN links into the head tag of your HTML document.
<link rel="stylesheet" href="https://fonts.googleapis.com/icon?family=Material+Icons" crossorigin="anonymous">
<link rel="stylesheet" href="https://cdnjs.cloudflare.com/ajax/libs/normalize/5.0.0/normalize.min.css">
2. Create the basic HTML structure for your organization chart. You can copy and paste the following code into your HTML file:
<body dir="ltr" outlines="0">
<section band>
<div data-chart="OC" C>
<div data-knot="branch" C>
<div data-knot="node.step.start">
<a data-symbol s a href="javascript:void(0)" title="example using <a>nchor">
<div class="header" clr="2"><div><i icon>account_balance</i><br>Group Board</div></div>
</a>
</div>
<div data-knot="node.step">
<a data-symbol s a href="javascript:void(0)">
<div class="header" clr="3"><div><i icon>account_balance</i><br>Board Committees</div></div>
</a>
</div>
</div>
<div data-knot="branch">
<div data-knot="node.lft">
<div data-knot="step">
<div data-symbol id="symAudit">
<div class="header"><div>Audit</div></div>
</div>
</div>
</div>
<div data-knot="node.ctr">
<div data-knot="step">
<div data-symbol>
<div class="header"><div>Remune­ration and Human Resources</div></div>
</div>
</div>
</div>
<div data-knot="node.ctr">
<div data-knot="node.step"><!-- empty data-knot for vertical line --></div>
</div>
<div data-knot="node.ctr">
<div data-knot="step">
<div data-symbol>
<div class="header"><div>Social Ethics</div></div>
</div>
</div>
</div>
<div data-knot="node.rgt">
<div data-knot="step">
<div data-symbol id="symNominate">
<div class="header"><div>Nominations</div></div>
</div>
</div>
</div>
</div>
<div data-knot="branch">
<div data-knot="node.lft">
<div data-knot="step">
<a data-symbol s a href="javascript:void(0)">
<div class="header" clr="3"><div><i icon>account_balance</i><br>Compliance Committee</div></div>
</a>
</div>
</div>
<div data-knot="node.ctr">
<div data-knot="node.step"></div>
</div>
<div data-knot="node.rgt">
<div data-knot="step">
<a data-symbol s a href="javascript:void(0)">
<div class="header" clr="3"><div><i icon>account_balance</i><br>Executive Committees</div></div>
</a>
</div>
</div>
</div>
<div data-knot="branch">
<div data-knot="node.lft">
<div data-knot="step">
<div data-symbol>
<div class="header"><div>Group Searching</div></div>
</div>
</div>
</div>
<div data-knot="node.ctr">
<div data-knot="step">
<div data-symbol>
<div class="header"><div>Group Operation</div></div>
</div>
</div>
</div>
<div data-knot="node.ctr">
<div data-knot="node.step.stop">
<div data-symbol>
<div class="header"><div>Group Talent</div></div>
</div>
</div>
</div>
<div data-knot="node.ctr">
<div data-knot="step">
<div data-symbol>
<div class="header"><div>Group Treasure</div></div>
</div>
</div>
</div>
<div data-knot="node.rgt">
<div data-knot="step">
<div data-symbol>
<div class="header"><div>Group Trans­formation</div></div>
</div>
</div>
</div>
</div>
</div>
</section>
</body>
The above HTML code uses custom data attributes (data-chart, data-knot, and data-symbol) to organize the chart elements. You can customize this structure according to your organization’s hierarchy.
3. The following CSS code contains styles for layout, fonts, colors, and animations for the chart. You can further customize the styling according to your needs. Add this CSS code to your proeject.
/************************************************/
/* Convenient global rules             [STABLE] */
/************************************************/
[outlines="1"] * { outline: 1px dashed } /* for debugging */

 *         { box-sizing: border-box }
html, body { width: 100%; max-width: 100% }
body       { margin: 0; min-height: 100vh }

a { text-decoration: none; color: currentColor }

[band] { display: flex; flex-flow: row wrap;
         justify-content: center; align-content: center;
         padding: calc(5vh + 48px) calc(19.5vw - 54.4px) }

/* generic flexbox shortcuts */
[F]         { display: flex }
[R]         { flex-direction: row    } /* horizontal: row of 1:N columns (FBL default) */
[C]         { flex-direction: column } /* vertical: column of 1:N rows   */
[W]         { flex-wrap: wrap }


/*
    KNOT LOGIC
    'branch' - 1:N 'node',1:N 'node.step' and 1:N 'step'
    'node'   - 1:N 'node' and 1:N 'step'
    'step'   - 1 data-symbol

    You can use flexbox shortcut attributes R (horizontal) and C (vertical) to
    determine the nesting direction of 'branch'es and 'node's. (R) is optional
    as horizontal is the default direction.

    (Depending on orientation of the knots, all kinds of nestings might work,
     but that will require trial and error, fiddling.)

    SPECIFICATIONS
    1) 'branch' has no specific rules, but acts as a container for 'node's
       and to distinguish from 'node' and 'step'.
       Add your own rules for specific 'branch' styling like fonts,colors,border,spacing.

    2) 'node' and 'step' only use :before and :after to position and draw
       connecting lines.

       'node'      horizontal line attachement
       'step'      vertical
       'node.step' both

    3) 'node.step' can be empty (no 'data-symbol'), in which case it will only
       draw cross lines.

    4) 'start' and 'stop' values are used to prevent drawing of
       starting and ending lines.

    5) Knot 'lft', 'ctr' and 'rgt' values define how sibling nodes are connected
       'lft' - left hand node, only one
       'ctr' - center nodes, can be more than one
       'rgt' - right hand node, only one

    My motivation for use of 'data-* attributes' instead of classes is they
    are easy accessible as javascript variables:

    someElement.dataset.chart
    someElement.dataset.knot
    someElement.dataset.symbol

*/

/***************/
/* Chart Setup */
/***************/
/* If you want the knots distributed as-is, remove 'align-items' */
[data-chart]        { display: flex; align-items: center } /* align [OPTIONAL], try! */
[data-knot]         { display: flex; flex-grow: 1 }        /* [MANDATORY] */

/* default alignments */
[data-knot]         { justify-content: center }
[data-knot*="node"] { align-items: stretch    }
[data-knot*="step"] { align-items: flex-start }

/* this code keeps the lines connect to the symbols */
[data-knot]         { position: relative; z-index: 1 } /* new stacking context */
[data-knot]:before,
[data-knot]:after   { position: absolute; z-index: -1; content: '' }
/* put some character in 'content' to keep track when debugging */

/* Horizontal lines ('node') setup */
[data-knot]:before  { top   :  1px } /* adjust -+1 for thickess of outlines */
[data-knot]:after   { bottom: -1px }

[data-knot*="node"]:before,[data-knot*="node"]:after
{ height: 0px /* for IE11 */; width: 50% }

/* Vertical lines ('step') setup */
[data-knot*="step"]:before,[data-knot*="step"]:after
{ width: 0px /* for IE11 */; left: 50%; right: 50% }

/* positioning of the lines ('lft','ctr','rgt') */
[data-knot*="ctr"]:before,[data-knot*="ctr"]:after
{ width: 100%; left: 0 }

/* (EITHER) Handles document reading direction (dir="ltr" in <body>), default is 'ltr' */
[dir="ltr"] [data-knot*="lft"]:before, [dir="ltr"] [data-knot*="lft"]:after { left : 50% }
[dir="ltr"] [data-knot*="rgt"]:before, [dir="ltr"] [data-knot*="rgt"]:after { right: 50% }

[dir="rtl"] [data-knot*="lft"]:before, [dir="rtl"] [data-knot*="lft"]:after { right: 50% }
[dir="rtl"] [data-knot*="rgt"]:before, [dir="rtl"] [data-knot*="rgt"]:after { left : 50% }

/* (OR) For use without [dir]
[data-knot*="lft"]:before, [data-knot*="lft"]:after { left : 50% }
[data-knot*="rgt"]:before, [data-knot*="rgt"]:after { right: 50% }
*/

/* line coloring */
[data-knot*="node"]:before,/*[data-knot*="node.step"]:after,/* REMOVE */
[data-knot*="step"]:before,[data-knot*="step"]:after { outline: 1px solid #666 }

/* no line drawing cases */
[data-knot="step"]:after, /* notice the missing '*' */
[data-knot*="start"]:before ,[data-knot*="stop"]:after { outline: none }

/*
    responsive sizes: T/B p1(320,6) p2(1280,24) and L/R p1(320,4) p2(1280,16)
    modify these to meet specific requirements.
*/
[data-knot*="step"]         { padding: 1.875vmin 1.25vmin }
[data-knot*="step"]:before  { height : 1.875vmin }              /* Same height as [data-step] T/B padding */
[data-knot*="step"]:after   { height : calc(100% - 1.875vmin) } /* pct to from below (minus T/B padding) */

/****************/
/* Symbol Setup */
/****************/
/*
    Chart 'data-symbol's, flexbox intended use

    FBL (V)     FBL (H)      Any
    --------    -------      -------
    (S)ymbol -> (H)eader  -> content
             -> (C)ontent -> content
             -> (F)ooter  -> content
*/
[data-symbol],
[data-symbol]>*         { display: flex }   /* S,H,C,F are flexbox parent containers */
[data-symbol]>*>*       { flex-grow: 1 }    /* sets default to 'fill' for content of H,C,F */

[data-symbol]           { flex-direction: column  } /* a column of 1:N rows */
[data-symbol]>.header   { align-items: center }

/* styling */
[data-symbol]           {
    text-decoration: none;

    color: currentColor;
    border: 1px solid gray;

    background-color: #efefef;
    border-radius: 50%;
    /* [OPTIONAL], only when using bg color. Make equal to br .header below */
}

[data-symbol]>.header {
    padding: .25rem .5rem;
    text-align: center;
    border-radius: 50%;

    /* responsive sizes: p1(320,50) p2(1920,180) */
    width : calc(8.125vmin + 24px);
    height: calc(8.125vmin + 24px);

    /*
        responsive fontsize: p1(320,6) p2(1920,20)
        Whether this works as expected depends on the minimum browser
        fontsize set by the user (content may overflow .header when set >6px)

        Tested defaults on W10:
        Edge2020 overflows, while Chrome, Firefox and IE11 do not
    */
    font-size: calc(.875vmin + 3.2px)
}

/**************************************/
/* Google Material Component inspired */
/**************************************/
[icon] {
    display: inline-flex;
    justify-content: center; align-content: center; align-items: center;

    /* responsive sizes: p1(320,14) p2(1280,32) */
    width      : calc(1.875vmin + 8px);
    height     : calc(1.875vmin + 8px);
    line-height: calc(1.875vmin + 8px);
    font-size  : calc(1.875vmin + 8px);
    /*
        A bit overdone for just one icon, use inline SVG instead,
        or create a small (subset) iconfont at https://icomoon.io

        icon list: https://material.io/resources/icons/?style=baseline
    */
    font-family: 'Material Icons';

    font-weight: normal; font-style: normal; letter-spacing: normal;
    text-transform: none; white-space: nowrap; word-wrap: normal;

    opacity: 1; /* GMC uses <1 here and 1 on :hover */
    font-feature-settings     : 'liga';
    -moz-osx-font-smoothing   : grayscale;
}

[clr="0"]       { background-color: Gainsboro; color: black }
.header,        /* .header here saves coding html */
[clr="1"]       { background-color: #fefefe; color: #1e1e1e }
[clr="2"]       { background-color: #1e1e1e; color: Yellow ; font-weight: bolder }
[clr="3"]       { background-color: #ffcc01; color: #1e1e1e; font-weight: bolder }

/*************************************/
/* Generic [S]hading and [A]nimation */
/*************************************/
/* Element [S]hading custom properties */
[S] {
    /* defaults */
    --clr-shadow: 0 0% 0%; /* HSL Black */

    /* GMD elevation 1dp, d - default + 0.1 */
    --elevate-d: 0px 2px 1px -1px hsl(var(--clr-shadow) / .20),
                 0px 1px 1px  0px hsl(var(--clr-shadow) / .14),
                 0px 1px 3px  0px hsl(var(--clr-shadow) / .12);

    /* when hovered */
    /* GMD elevation 3dp, h - hovered + 0.1 */
    --elevate-h: 0px 3px 3px -2px hsl(var(--clr-shadow) / .20),
                 0px 3px 4px  0px hsl(var(--clr-shadow) / .14),
                 0px 1px 8px  0px hsl(var(--clr-shadow) / .12);
}

[S="alt1" i] { /* some alternative shading, just testing */
    --elevate-d: 0 2px 30px 0 hsl(var(--clr-shadow) / .25);
    --elevate-h: 0 2px 50px 0 hsl(var(--clr-shadow) / .7);
}

/* Element [A]nimation custom properties */
[A] {
    /* defaults */
    --clr-inset: 0 0% 0% / 1; /* M3 theme default, black inset as outline (a11y) */

    --a-opa-d  : 1; /* opacity, set to < 1 if you want some default transparency */
    --a-scale-d: 1; /* scale */

    /* when hovered */
    --a-opa-h  : 1   ; /* opacity when animated hover */
    --a-scale-h: 1.02; /* scale when animated and hovered, tweak to your needs */

    --outline-d: inset 0 0 0 2px transparent;           /* default */
    --outline-h: inset 0 0 0 2px hsl(var(--clr-inset)); /* hover   */
}
/* [S]hading and [A]nimation defaults */
[S]     { box-shadow: var(--elevate-d) }
[A]     { opacity   : var(--a-opa-d)   }
[S][A]  { box-shadow: var(--elevate-d), var(--outline-d) }

/* [A]nimation actions */
[A]:hover { opacity: var(--a-opa-h); transform: scale(var(--a-scale-h)); text-shadow: none }

[A]:active:not(:focus), [A]:focus       { transform: scale(var(--a-scale-d)) }

/* [S]hading actions, but only when [A]nimated */
[S][A]:hover                            { box-shadow: var(--elevate-h) }
[S][A]:active:not(:focus), [S][A]:focus { box-shadow: var(--elevate-d), var(--outline-h) }

[S][A]:active:not(:focus) header,
[S][A]:active:not(:focus) footer {
    box-shadow: var(--outline-h);
} /* outline only, no shadow below/above */

/************************************************/
/* HTML CURSOR OVERRIDES               [STABLE] */
/************************************************/
body  { cursor: default } /* plain arrow for everything, but */
input { cursor: auto    } /* use HTML default cursor on inputs, unless: */

input:is([list="datalist"],
         [type="button"  ],
         [type="checkbox"],
         [type="radio"   ],
         [type="color"   ],
         [type="range"   ],
         [type="reset"   ],
         [type="file"    ],
         [type="submit"  ]),
label:not([for=""]),
a,button,select,keygen   { cursor: pointer }
[contenteditable="true"] { cursor: text    }
That’s all! hopefully, you have successfully created a Responsive Organization Chart. If you have any questions or suggestions, feel free to comment below.
Similar Code Snippets:

I code and create web elements for amazing people around the world. I like work with new people. New people new Experiences.
I truly enjoy what I’m doing, which makes me more passionate about web development and coding. I am always ready to do challenging tasks whether it is about creating a custom CMS from scratch or customizing an existing system.

